
The gap closes
Tested, part 1. Why a statistic can be true and trading it can still cost money.
All figures are hypothetical backtest results on E-mini S&P 500 and Nasdaq 100 futures, one-minute data since 2010, after costs. The case study explains how to read them.
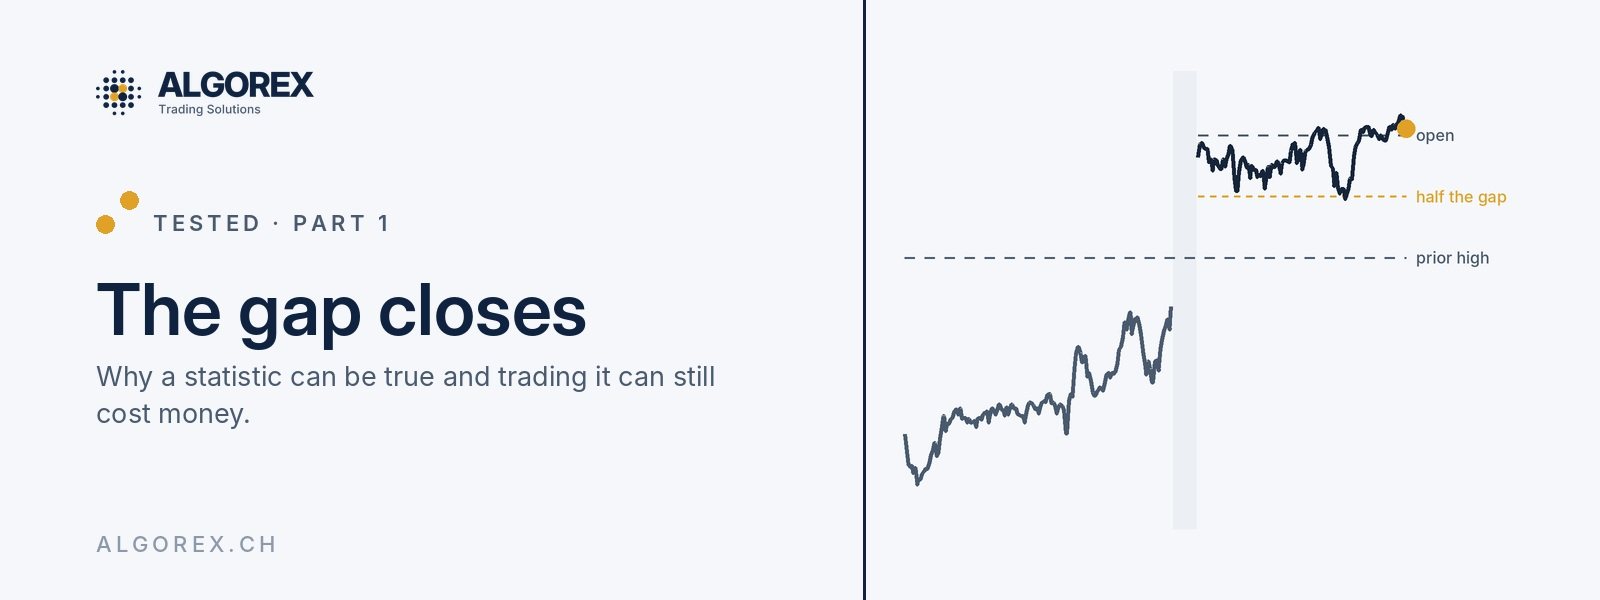
A popular statistic says that an opening gap usually closes halfway on the same day. The statistic is true. Trading it as a rule still lost money, because the few days the gap does not close cost more than the many small wins.
The claim
When the market opens outside the previous day's range, it retraces at least half the gap on the same day in roughly three cases out of four. The figure appears on statistics sheets, in course material and in many morning plans, usually between 76 and 79 per cent. From there it turns into a sentence that sounds like a trade: fade the gap, target half of it, win three times out of four.
Where the idea comes from
From auction theory. An open outside yesterday's range is treated as a price the market has not yet accepted. If it finds no follow-through, it returns to trade the prices it skipped. The reasoning is sound, and it is old. Only the percentage attached to it is new.
The test
E-mini S&P 500 and Nasdaq 100, New York cash session, one-minute data since 2010. A gap is any open above the prior day's high or below its low; that applies to about four trading days in ten. First the bare statistic: how often is half the gap reached before the close? Then the trade in mechanical form: enter at the open against the gap, target half the gap, stop one full gap away, otherwise exit at 15:55. Costs of half a point in the S&P and one and a half points in the Nasdaq per trade are deducted.
The result
The statistic holds. Over the last ten years half the gap was reached in 77 per cent of cases in the S&P and in 79 per cent in the Nasdaq. Over the last three years the figures are 78 and 80.
Trading it lost. Profit factor over ten years: 0.80 in the S&P, 0.90 in the Nasdaq; below 1 means a loss. Two numbers explain it. In the S&P the average winner made 7.1 points, the average loser cost 11.9. With the stop in place the rule won only 57 per cent of the time, because on some days price first ran against the position and came back afterwards.
Without a stop, then? The hit rate rises to 71 per cent, and the average loss to 19.4 points, three times the average win of 6.4. The profit factor stays at 0.80. The Nasdaq shows the same picture: 75 per cent winners, 29.7 points won against 100.2 points lost, profit factor 0.89. A stop twice as wide changes nothing (0.77 and 0.91).
Two cross-checks. Letting the gap run all the way to the prior close gave 1.00 and 1.10 over ten years, but a loss from 2010 to 2016. Doing the opposite and going with the gap gave 0.93 and 0.99. Neither direction pays.
For completeness: in the Nasdaq the rule with the tight stop was slightly positive over the last three years (1.08). Without a stop and with the wide stop it was negative there too. A result that depends on a single setting is not a result.
Why it is believed anyway
Because 77 per cent is true and feels like an edge. But the figure only says how often the target is touched. It does not say how far the market runs on the other days, and that is where the bill arrives: the gap that does not close is often the start of a day that goes one way. Those few days cost more than the many small hits bring in.
Van Tharp supplied the sober formula: a rule is not measured by its share of winners but by what a trade brings on average. Mark Douglas explained why the mind resists it: three wins in a row feel like skill, and the fourth day feels like bad luck. The journal says the opposite.
What remains usable
The gap is a place, not an entry. As a place it is valuable.
It tells you where price wants to go on most days: if you are already positioned against the gap for other reasons, half the gap is a target that is reached three times out of four. It also tells you where to be careful: buying with the gap means, on most days, buying shortly before a pullback.
And it supplies a question for the journal. If the gap does not close today, that is information about the day. Whether it can be read early enough we have not tested; a later part deals with that.
As a recipe the number is no use. As part of the morning picture it belongs on every desk.
All results are hypothetical backtests on historical data. They are no promise of future results and not investment advice.